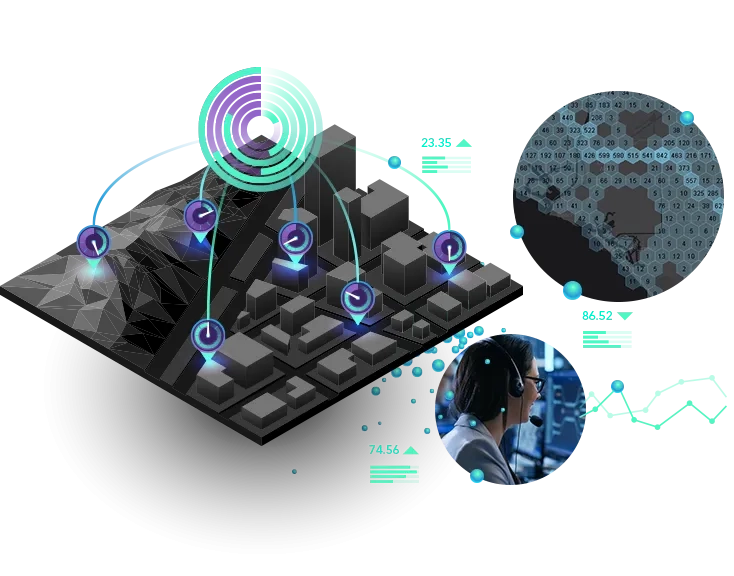
Tap into the Internet of Things (IoT) to analyze and display real-time data from sensors, devices and social media feeds. Gain situational awareness from streaming data whether you're tracking moving assets or stationary sensors. Focus on every event that matters with real-time monitoring and big data analysis so you can make the right decision, at the right time.
To get started with IoT data visualization and analysis call +880 1712 533 155 or submit an enquiry.
All data, all the time
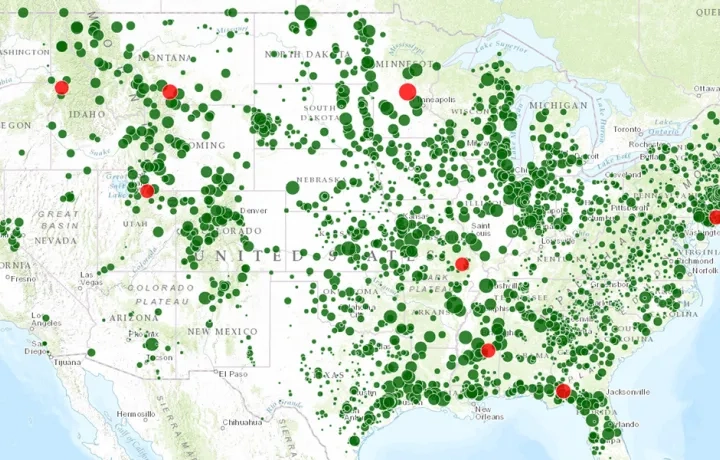
Leverage configurable inputs for any kind of data. ArcGIS GeoEvent Server can receive and interpret events from any data stream, including stationary sensors such as weather stations, moving assets such as vehicles, or events like crime and accidents.
Big data
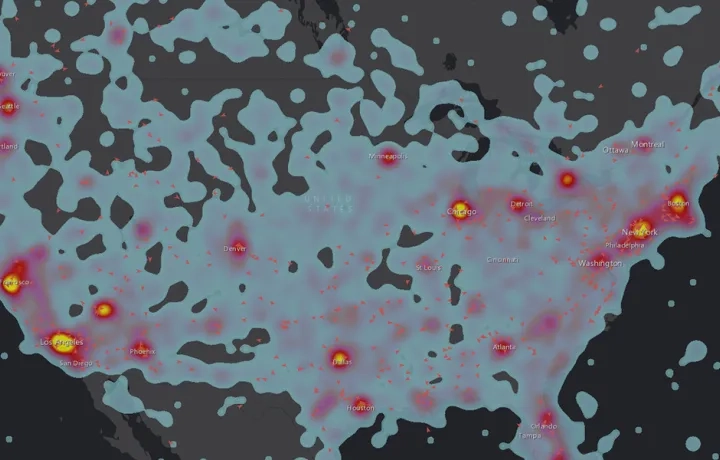
Analyze big data - streaming and real-time data - with ArcGIS GeoAnalytics Server to see where incidents occurred and examine where patterns have emerged. Beyond being a complementary product to your real-time feeds, GeoAnalytics Server can also analyze data from sources like Hadoop Distributed File System, Amazon S3 and Microsoft Azure Blob.
Real-time analysis
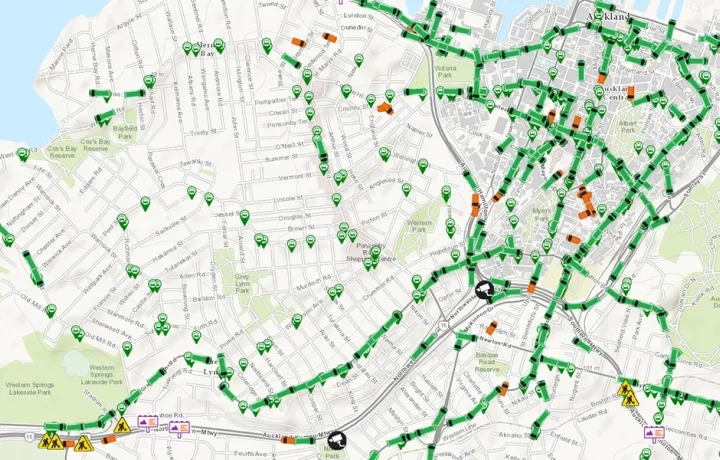
Process and filter data as it's received, including filtering for specific attributes in high-velocity and high-volume data. Determine spatial relationships of events with an established geofence such as a point, line or polygon.
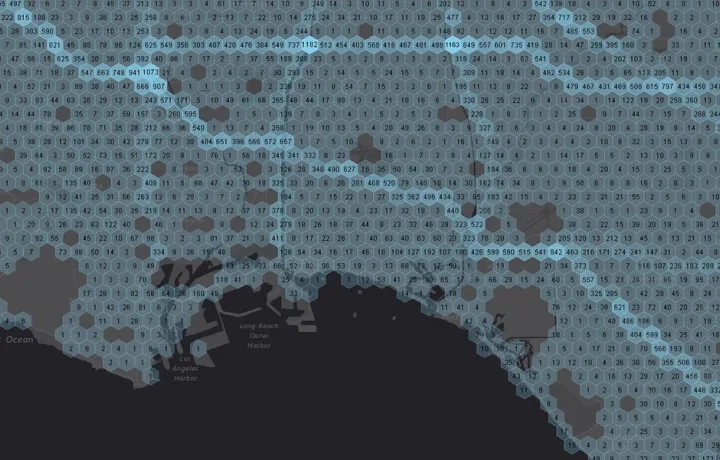
Big data analysis
Leverage the power of distributed computing to analyze and aggregate large amounts of stored data. Solve problems more effectively by using lightning fast analytical tools, from the simple to the complex. Detect how data has changed over time and pinpoint areas of interest. Find relationships, patterns, and anomalies with analytics in GeoAnalytics Server.
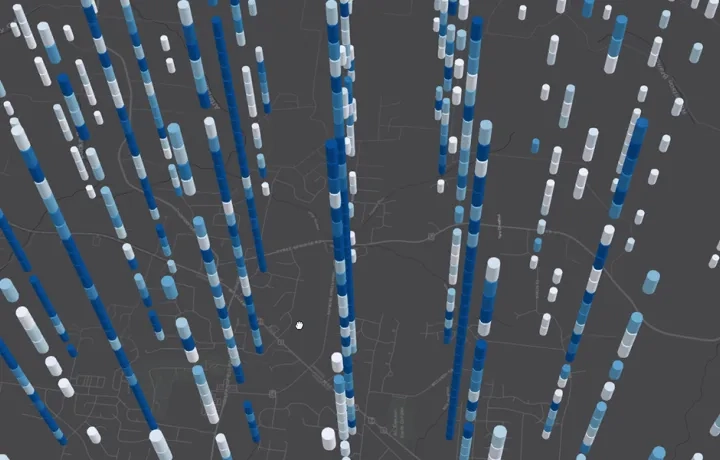
On-the-fly aggregation
ArcGIS GeoEvent Server receives and analyses events from a variety of data streams. Configure inputs including stationary sensors such as weather stations, moving assets such as vehicles, or point-in-time events like crime and accidents.
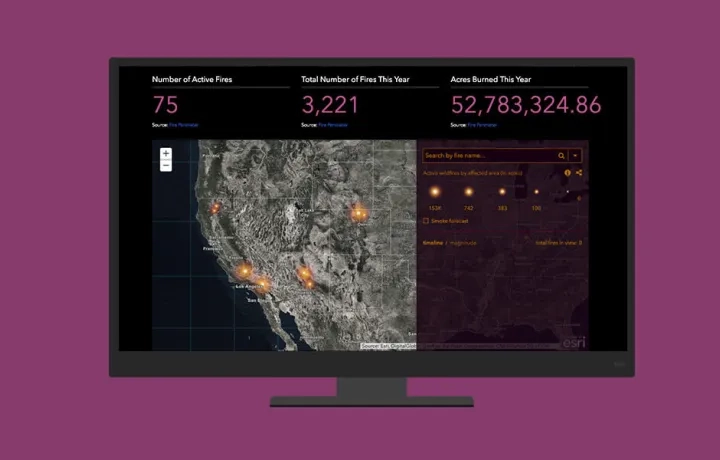
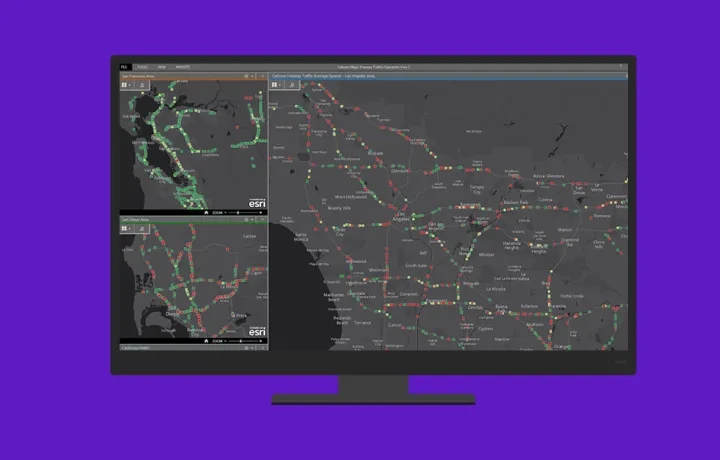
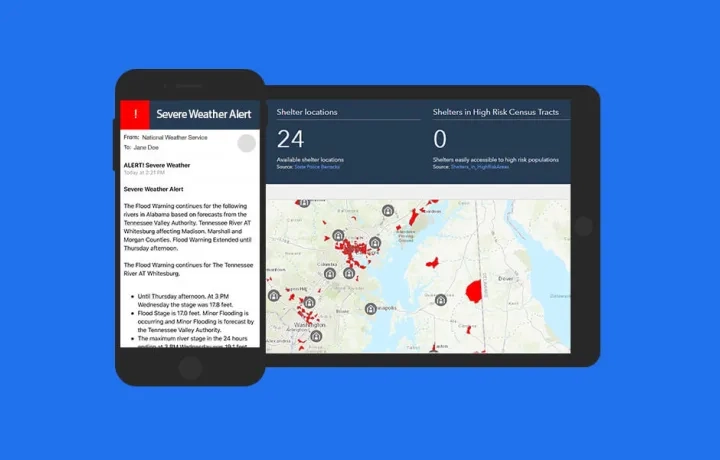
Operational Dashboards
Visualize IoT data on a dynamic dashboard with charts, gauges, maps, and other visual elements that show the status and performance of vital assets and events in real time. Operations Dashboard for ArcGIS can deliver a complete operating picture of your real-time, big data.
Notifications
Control how you want to disseminate the data by configuring outputs in the format you want. Whether by email or text message, you decide how an alert is sent to stakeholders.
Share information
Store and share observations and analysis. Make the data accessible for visualization, understanding, and improved decision-making. Control who and how much you share with users and groups.